library(tidyverse)
d  <- tibble(x = rnorm(100), y = rnorm(100))
d |> ggplot(aes(x = x, y = y)) +
       geom_point()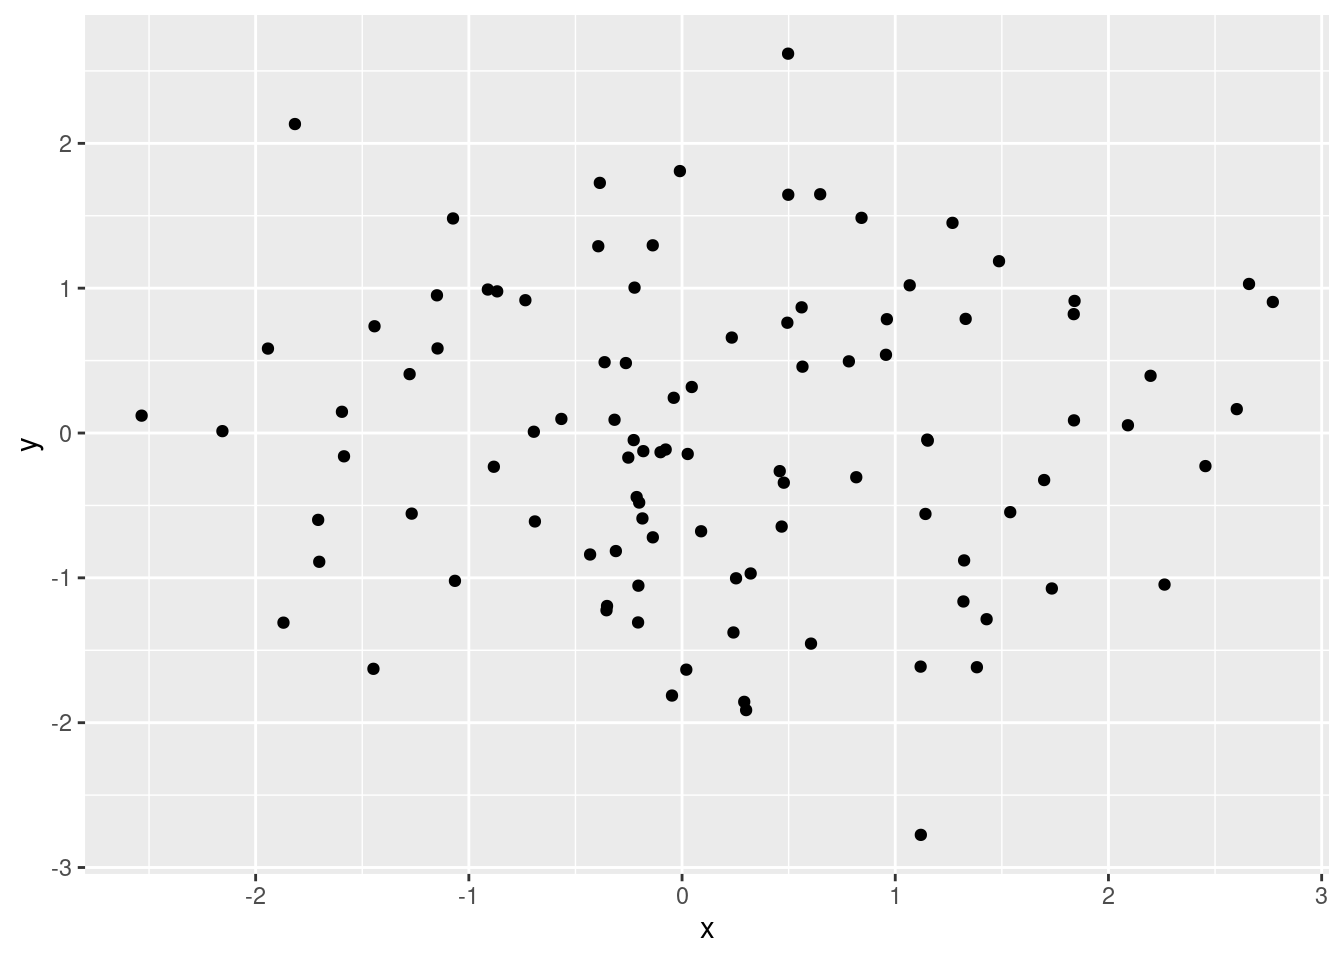
ggplot2: Elegant Graphics for Data Analysis (3e) is a good reference for all things ggplot
This plot shows the default theme for ggplot
library(tidyverse)
d <- tibble(x = rnorm(100), y = rnorm(100))
d |> ggplot(aes(x = x, y = y)) +
geom_point()
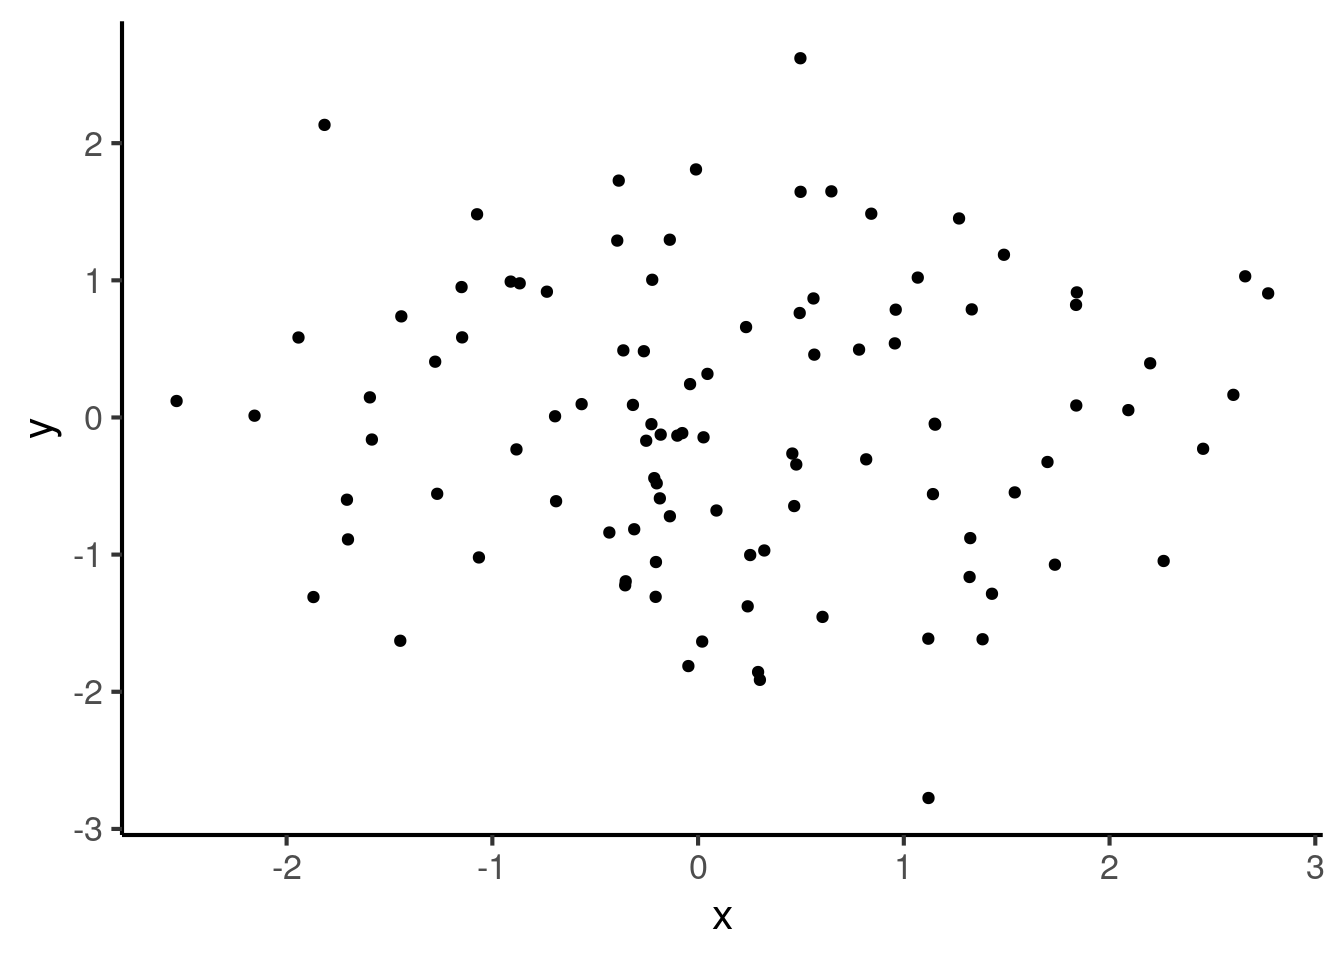
You can apply other built-in themes by adding them to the plot. Our preferred default is theme_classic()
d |> ggplot(aes(x = x, y = y)) +
       geom_point() +
       theme_classic()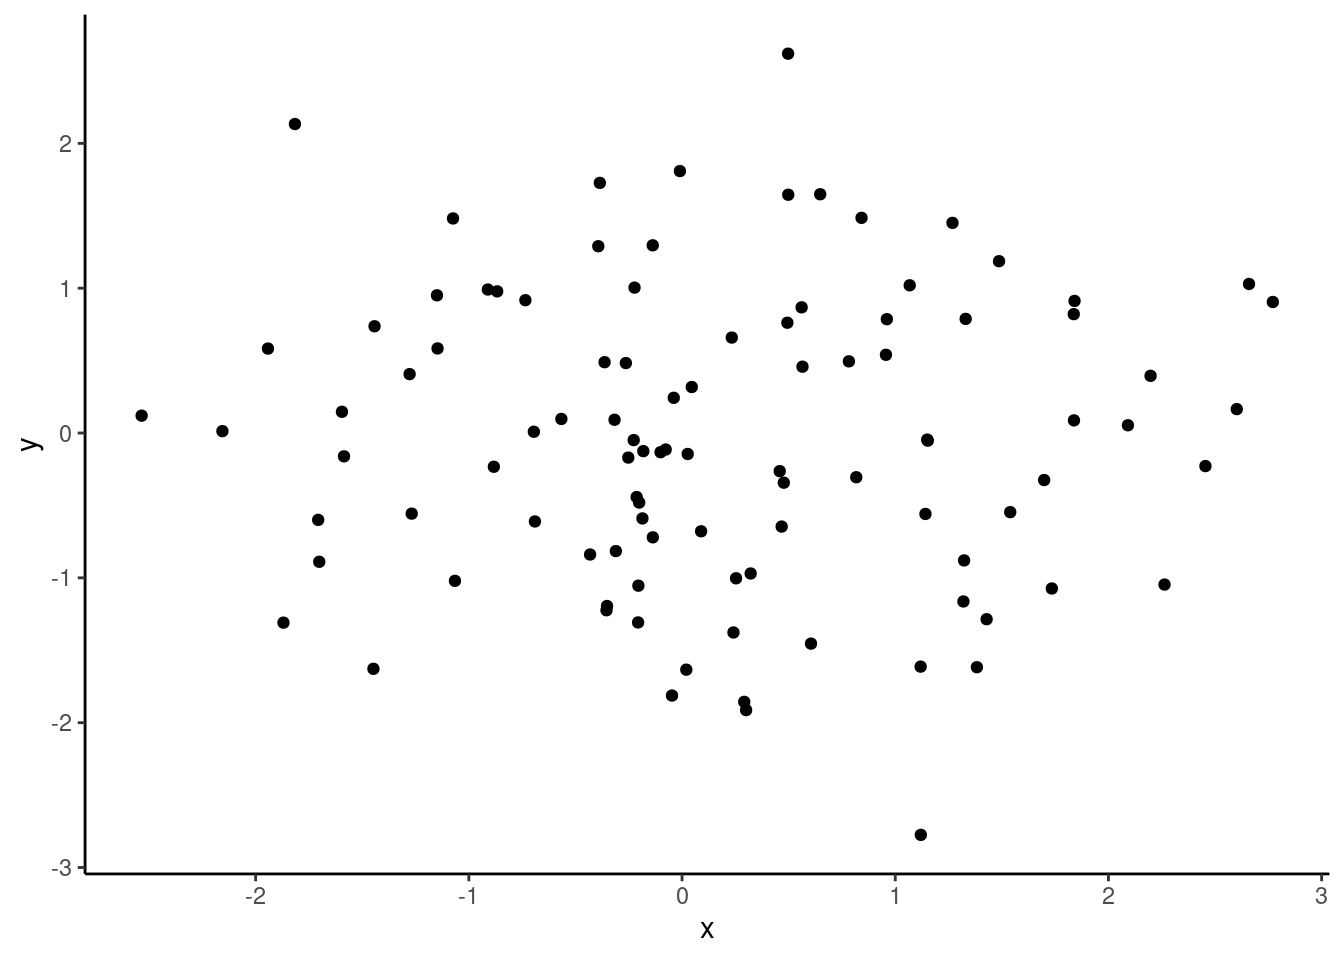
You may prefer to increase the size of axis labels, scale, and title (not displayed on this figure). All themes have a base_size parameter which controls the base font size. The base font size is the size that the axis titles use; the plot title is usually bigger (1.2x), and the tick and strip labels are smaller (0.8x). The default base_size = 11.
Here is an example setting base_size = 14. You might prefer this larger font for figures in a presentation.
d |> ggplot(aes(x = x, y = y)) +
       geom_point() +
       theme_classic(base_size = 16)
For consistent figures for all the the figures generated in notebook, you should set the theme at the top of the notebook as part of seting up your environment. This will also remove the need to apply a theme to each figure individually. Use theme_set() for this.
theme_set(theme_classic(base_size = 16))d |> ggplot(aes(x = x, y = y)) +
geom_point()