21 Psychophysiology Methods
Although we no longer focus on psychophysiology studies in our lab, this chapter is a central repository to share our gathered expertise and methods with other researchers.
22 Electronics and Psychophysiology
23 Hardware
23.1 Measure and record bioelectric signals (ERP, EEG, EMG, HR)
23.1.1 Neuroscan 64 channel Synamps 2
- Obsolete, replaced by Synamps RT (https://compumedicsneuroscan.com/product/synamps-rt-64-channel-eeg-erp-ep-amplifier/)
23.1.1.1 SynAmps2 Headbox Configuration:
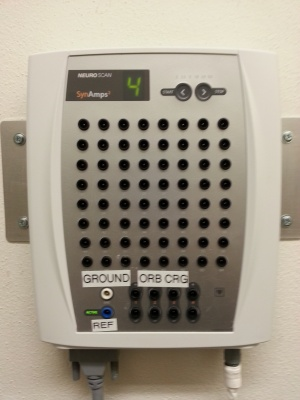
Synamps2 and SynampsRT require a signal input to the REF channel to accurately calculate impedances (this was not the case with Synamps1). Therefore, we use a small sensor placed on the forehead 1cm to the side of the ground (left side in Left Lab) which is connected to REF on the headbox.
The two channels (REF and GND) should NOT be jumped. REF and GND have 2 entirely separate functions when it comes to calculating the impedances and recording the data, hence by jumping the two channels, you are essentially combining their functions. The GND’s role is to reject common mode noise during data recording. The REF channel is not actually needed for bipolar EMG data recording, but will not degrade the signal, and therefore should remain plugged into headbox.
This applies to EMG recording only. When recording with EEG the REF sensor included on the cap should be used and no additional EMG REF input is needed on the headbox.
23.1.1.2 Neuroscap Hardware Filter Info
In the Synamp2 system the highpass is DC; however, if you record in AC, then a 0.05 Hz hardware highpass filter is applied to the data after front-end DC coupling. This filter is a single-pole Butterworth filter, and it’s 3dB down at 0.05. The lowpass hardware filter is also a single-pole Butterworth, 3dB down at a cutoff of 4,070 Hz. Note this is greater than the actual specified bandwidth of the device, which is 3,500 Hz (this is a pure software filter). The reason the hardware cutoff is > 3,500 is because the filter effects are additive (hardware + software), so the attenuation at 3,500 Hz from the hardware filter is only 0.5dB.
For the Synamp1, this information was a little harder to track down. The hardware filter in AC mode is a single-pole RC highpass, 6dB down at 0.05 Hz. The Synamp manual documentation lists the upper-end of the software filter at 3000 Hz, and the filter is 9dB down at that cutoff. This suggests to me that, due to the additive filtering effects, the hardware lowpass is very close to 3000 Hz as well; unfortunately I have not yet been able to track down any documentation on it. I will keep searching, but wanted to report my findings before too long!
23.1.1.3 Neuroscan AQUIRE software
- Obsolete, replaces by CURRY: https://compumedicsneuroscan.com/product/curry-data-acquisition-online-processing-x/)
- Historical Note: do not buy full SCAN package. You do NOT want EDIT. We use Matlab/EEGLab for data reduction. Also do NOT buy STIM, we use Matlab]
23.1.2 Grael
- Neuroscan 32 channel HD EEG mobile unit: https://compumedicsneuroscan.com/product/grael-4k-psg-eeg-erp-amplifier/
- mobile i/o USB-DIO24/37 http://www.mccdaq.com/usb-data-acquisition/USB-DIO24-Series.aspx
- mobile sound card - http://us.creative.com/p/sound-blaster/sound-blaster-e5
- Custom system from James Long: http://www.jameslong.net/
23.2 Data processing/reduction software
- MATLAB: http://www.mathworks.com/products/matlab/
- MATLAB Signal Processing Toolbox: http://www.mathworks.com/products/signal/
- EEGLab: Free download from http://www.sccn.ucsd.edu/eeglab/
- PhysBox: PhysBox: The Psychophysiology Toolbox https://arc.psych.wisc.edu/physbox/
23.3 Stimulus Control software
- PsychToolBox: https://github.com/jjcurtin/psychophysiology/tree/main/arc_library/PTB
- DMDX: Free download from http://www.u.arizona.edu/~kforster/dmdx/dmdx.htm
23.4 I/O card for inter-computer communication
- Parallel digital I/O card: All of the following can be obtained from Measurement Computing (https://www.mccdaq.com/)
- For desktop computer: PCI-DIO24 (https://www.mccdaq.com/pci-data-acquisition/PCI-DIO24-Series.aspx) & SCB-37 (https://www.mccdaq.com/productsearch.aspx?q=SCB-37) & C37FFS-5 Cable (https://www.mccdaq.com/productsearch.aspx?q=C37FFS-5) 2 feet long is the standard length I use. However, it is Available in 1, 2, 3, 4, 5, 10, 15, 20, 25, and 50-foot lengths on their website
- For notebook computer: PC-CARD-DIO48 & SCB-50 & CPCC-50F-39 (see also USB option for notebooks)
- 24-channel PCI-bus compatible, logic-level digital I/O board: https://www.mccdaq.com/pci-data-acquisition/PCI-DIO24-Series.aspx USB 24-channel Digital I/O Board with 37-Pin D-Sub Connector (for notebook): https://www.mccdaq.com/usb-data-acquisition/USB-DIO24-Series.aspx - We purchased this dio card but it is not supported currently by PTB. So we purchased the USB 1024LS instead (see below)
- USB-1024LS-channel Digital I/O Device Connector (for notebook): http://www.mccdaq.com/usb-data-acquisition/USB-1024LS.aspx
- Signal connection box, 37-conductor, shielded: https://www.mccdaq.com/products/screw_terminal_bnc.aspx#
- Cable, 37-conductor shielded, female to female molded connectors, 5 ft. long: https://www.mccdaq.com/Products/cables-adapters
- Screw terminal Adapter
- For Desktops:
- CIO-MINI37 (https://www.mccdaq.com/productsearch.aspx?q=CIO-MINI37): This works for most applications.
- CIO-MINI37-VERT (https://www.mccdaq.com/productsearch.aspx?q=CIO-MINI37): This one has the connector configured vertically. Might be useful in some applications if you are building into a box that requires this orientation.
- For notebooks:
- CIO-MINI50 (https://www.mccdaq.com/productsearch.aspx?q=CIO-MINI50): This works for most applications
- For Desktops:
23.5 Intercom and audio stimulus control
Mackie 1202 VLZ3 audio mixer-amplifier: http://www.mackie.com/products/vlz3series/splash.html
Mackie 802-VLZ3 8-Ch. Compact Recording/SR Mixer: http://www.amazon.com/Mackie-802-VLZ3-8-Ch-Compact-Recording/dp/B00132EJKG/ref=pd_bbs_sr_1?ie=UTF8&s=musical-instruments&qid=1239029418&sr=8-1
Sennheiser HD280Pro headphones: https://en-us.sennheiser.com/hd-280-pro
Shure Microflex MX418 D/S: http://www.shure.com/americas/products/microphones/microflex/mx412-mx418-gooseneck-microphones
Audio Technica Cardiod Pro 44: http://www.audio-technica.com/cms/wired_mics/8ba9f72f1fc02bc5/index.html
Radio Shack digital sound level meter (model: 33-2055): (Obsolete) https://www.amazon.com/Radio-Shack-33-099-Digital-Sound/dp/B000A1EHGW
Acoustic Calibrator DR1-R (use with sound level meter to calibrate acoustic signal from headphones): http://www.digital-recordings.com/coupler/coupler.html
Propoint Boundary Microphone: http://www.amazon.com/Audio-Technica-PRO44-Propoint-Boundary-Microphone/dp/B0002BBOOS/ref=sr_1_3?ie=UTF8&s=electronics&qid=1239029218&sr=8-3
23.6 Audio Recording
- Shure Mic Mixer model M68: (Obsolete) https://pubs.shure.com/view/guide/M68/en-US.pdf
- Realistic 33-1090B PZM Pressure Zone Microphones: (discontinued) see http://www.uneeda-audio.com/pzm/pzm1.jpg for image.
- Behringer BEQ802USB Xenyx Q802USB Premium 8-Input 2-Bus Mixer ordered 5/26/2016 from http://www.bhphotovideo.com for mobile lab
23.7 Video observation
PolarisUSA 1/3” B/W Brick Camera: Model BC-600B, replaced by http://polarisusa.com/pvi4?func=product&id=475
PolarisUSA Portable Infrared Illuminator, 1.2 AMP Power Supply Included: http://www.polarisusa.com/product/46/IR-TILE.html
PolarisUSA 12V DC Power Supply: http://polarisusa.com/product/1352/ps-12v-1a
6” Camera Stand: http://polarisusa.com/pvi4?func=product&id=604
Black CCTV Monitor: http://www.lcdracks.com/monitors/LYNX/M-Pro-CCTV-19.php
23.8 Handheld impedance meter (for ERP/EEG only)
- Prep-Check electrode impedance meter (EIM 105-30Hz): [ http://www.general-devices.com/eim105.htm Obsolete, replaced by https://www.biopac.com/product/electrode-impedance-checker/
23.9 ERP/EEG electro caps
- Electro-cap International: http://www.electro-cap.com/
- We use custom cap configurations. See the Order form (
P:\Documentation\Hardware\EEGCaps&Connectors\CustomCapOrderForm.pdf) and PinoutsP:\ Documentation \Hardware\EEGCaps&Connectors\ECICapPinout.pdf)
- We use custom cap configurations. See the Order form (
- Electrode Board Adapter (E2S): http://electro-cap.com/index.cfm/pricing/
23.10 Ag/AgCl sensors
Large Ag/AgCl electrode. TDE-022-Y-ZZ-S Electrode, 8mm, and 48in lead length: http://www.discountdisposables.com/electrodes/reusable-electrodes/tde-022-y-zz-s-electrode-8mm.html
Small Ag/AgCl electrode; TDE-023-Y-ZZ-S Electrode, 4mm, and 48in lead length: http://www.discountdisposables.com/electrodes/reusable-electrodes/tde-023-y-zz-s-electrode-4mm.html
23.11 Shock electrodes
- As of 12/2016, we currently have 2 older sets of non-disconnectable and 2 sets (one at CRU) of disconnectable electrodes.
None of these three are shielded/grounded.
The newer types currently in use are:
1. in left lab are grounded and shielded, non-disconnectable. 2. in right lab are grounded and shielded, disconnectable. 3. in CRU mobile lab, are grounded and shielded, disconnectable.
The shock electrode wires act like a big antenna, so over time we have made multiple adjustments to try and reduce the interference from them: * All our new cables are now shielded and grounded to the i/o box. * The wires should be shielded as far up to the electrodes as possible. Any gap on the shielding increases antenna interference again. If they are to be disconnectable, shielding can terminate at the disconnect, but disconnectable ones will always have more interference than non-disconnectable. * The unshielded portion of the wires (whether or not disconnectable) should be as short as possible. Ideally 3-4”, just enough to allow them to be connected to the two fingers of various size hands. * The cable itself should be as short as possible, because the length alone is a factor in the strength of the antenna being formed. Right now about 16 feet seems to be working well (left lab).
23.12 Miscellaneous equipment
- 2 Port 250 MHz VGA Video Splitter (ST122L): http://www.startech.com/Product/ItemDetail.aspx?productid=ST122L&c=US
23.13 Computers
- 2 computers, one for data acquisition, one for stimulus control
23.14 Sound Cards
- 185L: Creative Sound Blaster X-Fi Titanium PCI Express Sound Card: (Obsolete)
- 185R: Creative Sound Blaster ZxR PCIe Audiophile Grade Gaming Sound Card http://us.creative.com/p/sound-blaster/sound-blaster-zxr
- Sound Blaster E5 external sound card (for notebook): http://us.creative.com/p/sound-blaster/sound-blaster-e5
23.15 Monitors
2 LCD flat panel for experimenter to view physiology and experimental stimuli
1 large CRT for participant display
Optional: Support to mount LCDs on wall to save desk space
23.16 Psychophysiology supplies
See Psychophysiology supplies under P:\\private\ Documentation \Supplies\CommonLabSupplies.docx
23.17 Psychophysiology Peripherals Diagrams
24 Hardware Testing
24.1 Calibrate White Noise Startle Probes for HD280Pro
Record the decibels before and after calibration in a Startle Probe Calibration Log .xlsx file
These instructions are for the sound meter, the bigger one, that is housed in a suitcase, and has a headphone holder.
Bring this sound meter into the room where participants receive startle probes.
On the Mackie audio mixer, verify that the sub mix are is the indent/U and the main mix, which controls RA speaker volume, is turned all the way to the right/max. Verify that the computer volume never changes after initial calibration of the sound probe.

Pull the meter out of the suitcase and slip the metal sleeve over the meter:

The circular end of the meter should slip into a round opening at the top of the metal sleeve.
Turn the meter dials as follows:

The db range should be set to 100. 
The Batt dial should be set to A on the slow side. 
The frequency dial should be set to 250.
Pull the Batt dial out- (this turns the device on).
Loosen the wing nuts until you can move the metal arm on the top of the metal sleeve.
Slip one headphone in between the metal arm, and metal sleeve. The headphone should surround the round opening at the top of the metal sleeve:
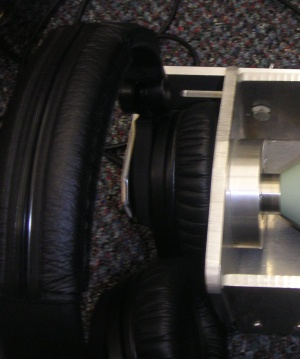
Tighten the wing nuts so that the headphone cannot slip out of this position however do NOT tighten the wing nuts such that the cushion on the headphone is pressed. The headphone cushion should be fully expanded as in the picture.
Turn on the computer that generates the startle (in both labs, it is the computer that is on the right), and open up DMDX or Matlab depending on how you control your stimulus presentation.
If using DMDX, click browse, and follow this file path: local/calibrate/CalibrateLong.rtf Select the CalibrateLong.rtf file, and hit run.
If using Matlab, type “CalibrateWhiteNoise” and hit Enter.
Now, hit the space bar to initiate the long probe.
Move quickly back to the sound meter, and check where the decibel needle is pointing. The goal is to get the needle to point to 2.
If the needle is not pointing towards 2, you will need to adjust the 5-6 gain dial on the audio mixer.
Check both headphones (left and right) and make sure both are outputting at 2.

For DMDX: If the probe ends before you can adjust the needle accurately enough, hit escape to get out of the file, do not save the data, and run the long startle probe calibration file again.
For Matlab: If the probe ends before you can adjust the needle accurately enough, hit “enter” and type “CalibrateWhiteNoise” and hit enter again.
Once you are finished Close DMDX or Matlab and shut down the computer.
Make sure to turn the sound meter off by pushing the batt dial back in. (if you do not- the battery will die)
Return the sound meter to its carrying case, and then to the shop.
24.2 Calibrate White Noise Startle Probes for ER-4S Ear Insert Earphones
The ER-4S has a known voltage input to sound intensity output function. This function can be used to calibrate the intensity of the startle probe, etc. This function is:
Intensity (dB) = 108 + 20 log10(voltage [in V])
Voltage should be measured in AC V using RMS (see note below on modifications present in Curtin Lab)
To measure this voltage you will need to build an adapter that will allow you to insert volt meter test point probes (black and red probes attached to meter) into a wire connected between your sound card and the ER-4S earphones. It is important that the earphones are connected when making this measurement b/c their presence in the circuit will affect the voltage measured. The easiest option is to splice two wires into a cable with male and female mini (1/8 inch) phono plugs. Splice one wire onto the ground/shield and the second to either of the audio channels (left and right ear should contain the same signal). Plug the male connector into the sound card, plug the earphones into the female end and alligator clip the meter probes onto the two wires you spliced in.
You should produce the sound with the software and wav file you intend to use for sound presentation b/c they both will affect the intensity of the sound. I have created two calibration scripts for DMDX:
- A long probe script (32s probe for calibration)
- A short probe script (standard 50ms probe to demo the probe if desired)
The script uses a short (50ms) and long (32 s) wav file for white noise. These must be in the same folder as the script. The long file was constructed with the same parameters as the short file and presents at the same intensity. If you calibrate with the long file, you should obviously use this short wav file in your experiments.
Here is a quick reference table for typical values to convert from observed voltage to dB. Intermediate values can be determined using the formula provided above.
| Voltage Input (V) | Sound Intensity Output (dB) |
|---|---|
| .2 | 94.0 |
| .3 | 97.5 |
| .4 | 100.0 |
| .5 | [.35V*] |
| .6 | 104.0 |
| .7 | 105.0 |
*IMPORTANT NOTE FOR CURTIN LAB. In our lab, our voltmeter is not RMS. 102DB should measure .5V RMS but on our meter it measures .35V. Calibrate to .35V using the 2V range setting
24.3 Testing Acoustic Startle Probes
[TestWhiteNoise.m](https://raw.githubusercontent.com/jjcurtin/psychophysiology/main/arc_library/PTB/TestWhiteNoise.m) is used to test acoustic startle probe presentation and timing relative to event code. TestWhiteNoise presents 10 white noise probes (WNProbe.wav) separated by 2s. Each probe is marked with an event code of 100. White noise onset should occur a short, fixed interval after event code if system is working properly.
24.3.1 Conducting the Test
- Open Matlab on Stimulus Control computer
- Type
TestWhiteNoiseat Matlab command prompt. Default is to analyze output in EEGLab. TypeTestWhiteNoise(false)if no analysis is necessary. - Open Neuroscan and select setup file that records probe channel and uses an event code hold value of 0 (e.g., NoiseTest_SynAmps1.ast; NoiseTest_SynAmps2.ast)
- View Neuroscan data and start saving. NOTE: Save to server if you want immediate access for analysis.
- Press any key on Stimulus Control computer to begin test
- Don’t forget to stop saving in SCAN once probes are complete!
24.3.2 Analysis of Output
- After data are collected, Matlab will display a dialog box to select data file and path
- Next input data type (16 bit/synamps 1 or 32 bit/symamps 2)
- Script will generate a plot of the 10 probe administrations
- Probe onset should be within 4 ms of 0 and consistent
- Probe offset should be near 50ms and consistent
- There should be no dead spots in signal
24.3.3 Troubleshooting
If there are issues (i.e. no sound coming from headphones) please check to see if the audio mixer is configured correctly by going to the Configuration document in P:\Documentation\Hardware\MackieMixer.
Also you can check to see if the sound card is configured correctly by checking the config document here: P:\Documentation\Hardware\SoundCards
24.4 Testing Response Time Accuracy
TestResponseTime.m is used to verify that behavioral response input time is accurate. To be used with a response box that simulates participant input. When box is triggered, it produces an input exactly 434ms later. The script completes 200 presentations of this simulated input. This can be changed by passing a different input such as “TestResponseTime (365)”
24.4.1 Performing the Test

Placement of banana plugs on the Breakout Box (see diagram in P:\Documentation\Hardware\IO if needed). The cord from the breakout box is the grey one coming in right center, over the VGA Splitter
Refer to the IO Card Pinout diagram (P:\Documentation\Hardware\IO) if needed:
- Turn off the stimulus computer.
- Response box BLACK plug should be connected to GND (pin 19).
- GREEN plug should be connected to PortB output B0 (pin 10)
- WHITE plug should be connected to PortA input A1 (pin 36). This assumes testing is on line 1 (negative).
- RED should be connected to +5v (pin 18)
- Turn on the computer
- Start Matlab and type
TestResponseTime - Press any key on Stimulus Control computer to initiate test
When unplugging the box, first turn off the computer, then be sure to unplug the BLACK plug (GND) last.
24.4.2 Interpreting Test Results
After data are collected, Matlab will display stats and a histogram
Responses should be constant with no bias (within ~ 5ms).
24.5 Testing Neuroscan Event Codes
TestEventCodes.m is used to output a series of event codes from the Stimulus Control computer to the Physiology computer. This test script will also determine if the time between event codes appears to be accurate (as recorded by the Stimulus Control computer).
24.5.1 Conducting the Test
- Open Matlab on the Stimulus Control computer
- Open Neuroscan and select any setup file that uses an event code hold value of 0 (e.g., TestSynamp1.ast synamp1; synamps2)
- Start viewing data in Neuroscan
- (Optional) Start saving data in Neuroscan. This will allow you to do a more rigorous test of event code timing as recorded on the Physiology computer
- Type
TestEventCodesat Matlab command line. NOTE: By default TestEventCodes outputs a series of 10 event codes [1:5, 101:105]. However, you can output a series of any length of any values by providing EventCodes as an argument. e.g., TestEventCodes([1 11 101 151 201]).
24.5.2 Interpreting the Output
- You should see the appropriate event codes on the bottom of the Neuroscan screen
- TestEventCodes will return the mean time between events. It should be 2.000s
- If you omit the semi-colon when you type TestEventCodes, it will also return the time between each event
24.6 Testing Display Presentation Timing
24.6.1 General
TestDisplay.m TestOutput.mis used to verify that display timing is accurate and synched to event codes. The script completes 100 presentations of a full screen white “box” with black ITIs. The ITI is a function of the refresh rate and the FlipFrame argument to the function but the default is appropriate for almost all use. The script will mark each trial onset with an event code (1) and report statistics on trial onset timing as monitored by Psychtoolbox. Obvious tearing of the image will indicate serious timing problems. Significant departure from expected ITI time and or large SD in observe ITIs will also indicate a problem. If you use a photoresistor, you can verify that trial onset is synched with event codes.
NOTE: Older video drivers can throw errors due to the split monitor signal. If this is the case, unhook the splitter so the participant monitor is directly connected to the matlab computer. Run the test, confirm the results are good, then reconnect the splitter.
24.6.2 Placement of photoresistor

24.6.3 To record event codes and photoresistor output
- Using suction cup, place the end of the photoresistor on the upper left corner of the display to be tested. Get as close to the top and left edges as possible.
- Connect to headbox for your specific physiology equipment following the instructions below
- Turn on the photoresistor by flipping the toggle switch on the black box. Connections Instructions
24.6.3.1 For Grael EEG
- Connect photoresistor leads to BP40 (or whatever channel ORB is set to in your set up file) on the Grael EEG box. Make sure to connect the BLUE lead to the NEGATIVE channel and the WHITE lead to the POSITIVE channel.
24.6.3.2 For Synamps II
- Connect photoresistor leads to BP2 (or whatever channel ORB is set to in your set up file) on the neuroscan box. Make sure to connect the BLUE lead to the NEGATIVE channel and the WHITE lead to the POSITIVE channel.
24.6.3.3 For Synamps I
- Connect photoresistor leads to BP32 on the neuroscan box. Make sure to connect the BLUE lead to the NEGATIVE channel and the WHITE lead to the POSITIVE channel.
24.6.3.4 For James Long
- Connect photoresistor BNC to BNC input in control room.
24.6.4 Performing the Test on Synamps amplifier (most of ARL)
- Start Matlab and type TestDisplay. Wait for the “press any key” prompt to come up.
- Start Neuroscan and select a setup file with an event hold value of 0 and a channel to record output from the photoresistor. Example files can be used: synamps2TestDisplay.ast.
- Press acquire and begin recording. You will be prompted to save the file; save locally in the Matlab-accessible folder
- Press any key on Stimulus Control computer to initiate test
- When Matlab prompts that the test has ended, stop data collection.
- Matlab script will automatically ask you to browse to the saved file, and then display the data
24.6.5 Performing the Test on Grael EEG amplifier (mobile lab)
- Start Matlab and type TestDisplay(20,1,0,1). Wait for the “press any key” prompt to come up.
- Start Curry and select a setup file with an event hold value of 0 and a channel to record output from the photoresistor. Example files can be used:(see Kaye2 for example)
- Select your save path; save locally in the Matlab-accessible folder (or copy to server after recording to allow matlab to access file).
- Press Play to connect to amplifier and press record and begin recording.
- Press any key on Stimulus Control computer to initiate test
- When Matlab prompts that the test has ended, stop data collection (and move Curry *.dat file to server if matlab doesn’t have access to Curry computer).
- Matlab script will automatically ask you to browse to the saved file, and then display the data ### Performing the Test on James Long Note this section may be outdated and if so should be removed
- Start SnapMaster after selecting a setup file with an event channel
- Display and save data file locally with Neuroscan and SnapMaster
- Move saved data file from local drive to server
- Select file from server (Matlab script will automatically display data) Interpreting Test Results Zoom in near zero on the x axis. Onset of each white screen should be consistent (each voltage line). There should be no severe deviations or dead spots in the signal

DisplayTest.m Output
24.7 Testing IO Output
[TestOutput.m]https://raw.githubusercontent.com/jjcurtin/psychophysiology/main/hardware/hardware_testing/TestOutput.m) is used to test a single digital output from Stimulus Control computer. This can be on either port B or C (the two output ports). This can be used to test event codes to neuroscan or to test TTLs on port C (for external devices such as shocker).
In Matlab type TestOutput(Output, Port), where output is 8-bit integer (0-255) and Port is either ‘B’ or ‘C’. ‘B’ is default if omitted. e.g., TestOutput(100,'B')
25 EEG
25.1 32 Channel Caps
25.2 64 Channel Caps

64 Channel Cap Diagram - Custom 32Ch Cap Order Form
- 64 Channel Pinout
26 Sensor Placement
This section will cover sensor preparation and placement for EMG, Skin Conductance and Heart Rate. For each of these measures, pre-participant preparation, participant preparation, sensor placement and sensor cleaning procedures are described below. There are many similarities in the preparation procedure across measures. Important differences between measures are highlighted.
26.1 Sensor Placement Videos
26.2 Pre-participant preparation
For all measures, prior to the arrival of the participant you should:
- Fill “gel applicator” with gel
- Locate a gel applicator body and applicator tip (in kitchen room on sink counter in organizer)
- Prior to attaching the tip, insert the applicator body into the conductive gel in the Tupperware container with plunger completed depressed. Slowly withdraw the plunger until the applicator body is almost full (for EEG) or about 2mL (for EMG only). This may take a few attempts.
- Wipe off the excess
- Attach applicator tip
- Cut sensor collars
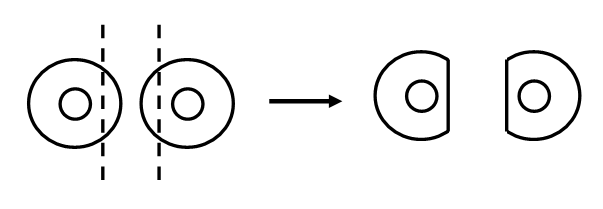
- The EMG sensor collars are cut in order to allow them to be placed closer together and closer to the site of EMG activity. There are two different cutting procedures: one for obicularis and corrugator and a second for zygomatic.
- For obicularis and corrugator, we cut both the top and insides of the collars to allow the sensors to be placed close together and near either the eyelid (for obicularis) or the eyebrow (for corrugator)

- For zygomatic, we cut only the inside of the sensor collars to allow the sensors to be placed close together.
- Place sensor collars on sensor cups.
- There are two sizes of sensors, depending upon the measure used.
- The miniature sensors are used for facial EMG (obicularis, corrugator and zygomatic)
- The standard sensors are used for skin conductance, heart rate and the ground sensor.
- Locate the appropriate size sensor collar and affix to the sensor such that the hole in the collar fits exactly around the sensor cup surface and the tab is in line with the sensor lead (wire). Make certain that the collar is securely attached by rubbing firmly with your thumb.
26.3 Participant Preparation
Have the participant wash their hands and face with warm soapy water to remove make-up and dirt/oils. Make certain that they thoroughly dry hands and face afterwards. Explain to them that this is to allow for better measurement of the physiological signals that we are collecting.
Prepare each site to reduce sensor impedance for all measures except skin conductance. No preparation is done for the skin conductance site. The preparation is performed in two steps. Make certain that you explain each step to the participant prior to beginning.
- Clean the area with an alcohol prep pad. Make certain that you have the participant close their eyes if you are anywhere near the eye. Be gentle, but firm with cleaning.
- Clean the area with the exfoliating gel (Nu-prep). Put a small dollop on Nu-prep on the end of a gauze pad. Rub the gauze pad over the placement site. If possible, rub in multiple directions to further reduce impedance. Again, be firm but gentle. Be particularly gentle with the obicularis site under the eye. After rubbing the gel into the site, use a clean portion of the gauze pad to remove excess gel from the skin.
- Clean the area with an alcohol prep pad. Make certain that you have the participant close their eyes if you are anywhere near the eye. Be gentle, but firm with cleaning.
26.4 General information on Sensor Placement
Prior to the application of each sensor, you will need to fill it with gel. All of the measures use the same conductive gel (in the large Tupperware container) except for skin conductance. It is VERY IMPORTANT that you do not use the conductive gel for the skin conductance sensors. This measure has its own gel.
For all sensors but skin conductance, you will fill the sensor cup evenly with gel from the gel applicator such that the gel slightly overfills the cup. Do not overfill too much as it will interfere with the sensor collar adhering to the participant. It is VERY IMPORTANT that you do not touch the sensor cup surface with the gel applicator tip. This will destroy the Ag-AgCl coating.
For skin conductance, you will fill the sensor cup with gel directly from the skin conductance gel bottle. You want the gel to completely fill the sensor cup but not overfill at all.
26.5 Sensor Locations
Sensor location and procedures are described below for each measure separately. When placing sensors on the face, position the sensor leads back behind the ear after placement to avoid the lead dangling in the face of the participant.
26.5.1 Obicularis Placement (miniature sensors)
- Prior to attaching these sensors inform the participant that the sensors will feel a bit funny under their eye and may make their eye blink and water for a few moments. Tell them that they will get used to the feeling within a few minutes.
- Tell the participant to look directly forward and up. Place the first sensor under the eye and directly in line with the pupil. You should place the sensor such that the collar top fits right into the crease under the eyelid.
- Place the second sensor directly next to the first and to the outside (and slightly superior if possible) of the first sensor such that the collars just touch. Again, this should place the top of the collar right into the crease under the eye.
- Plug end of sensor leads into the headbox. Place the first sensor lead into the – (bottom) channel and the second into the + (top) channel.
26.5.2 Obicularis Placement with EEG Cap VEOG, Ground, and Reference Sensors
- Follow the instructions above to place the obicularis sensors on the eye closest to the headbox (location therefore differs depending on which lab, see images below)
- Place the VEOG sensors on the other eye. Place the lower sensor directly under the eye and in line with the pupil, and the upper sensor directly above that, immediately above the eyebrow.
- Place the large Ground sensor about 1” from the bridge of the nose, slightly towards the VEOG side. Be careful it will not be rubbed or disloged by the edge of the EEG cap.
- Place the smaller Reference sensor next to the Ground sensor, slightly towards the orbicularis side. Be careful it will not be rubbed or disloged by the edge of the EEG cap.
VEOG placement with headbox on participant’s left: 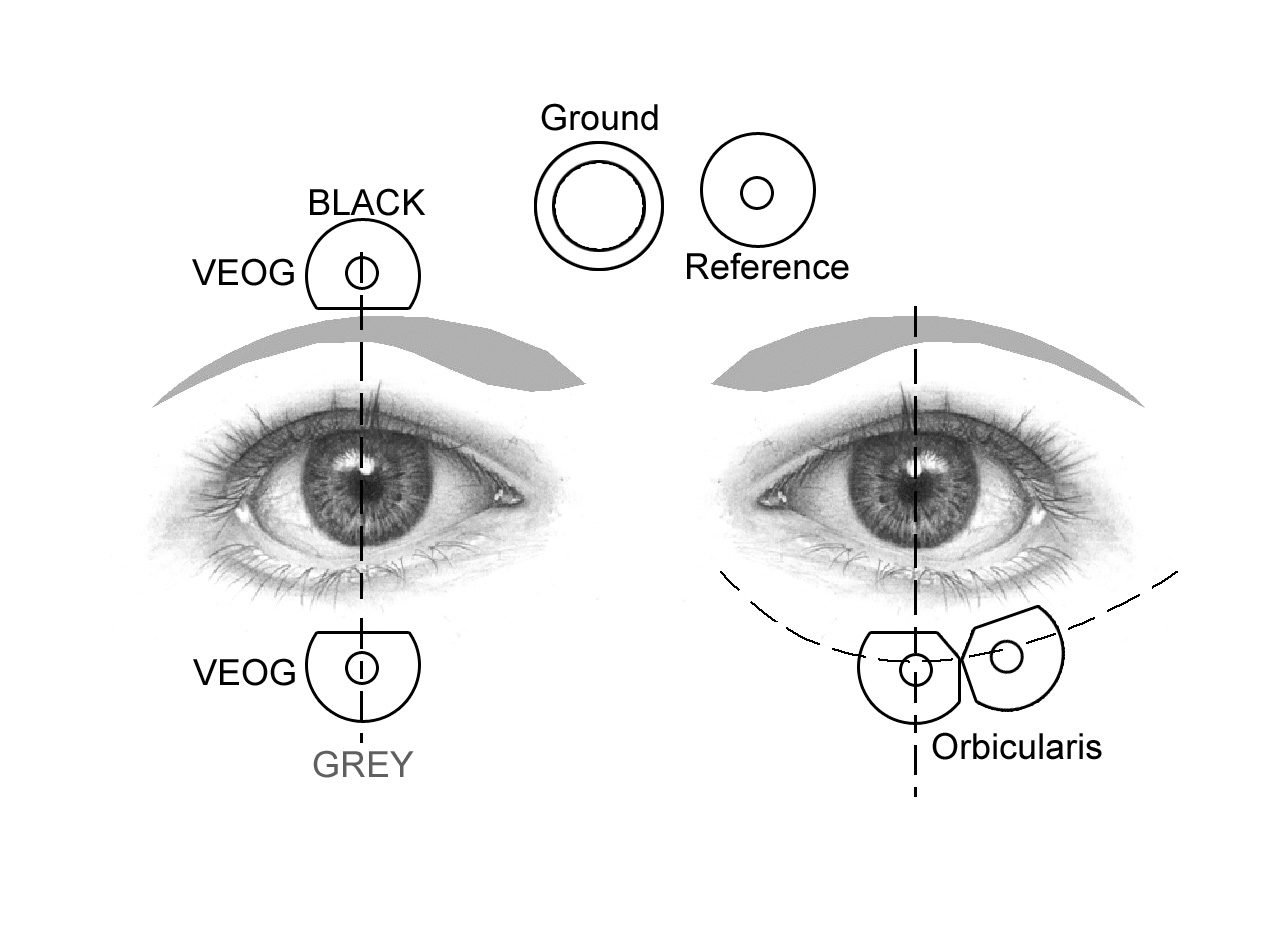
VEOG placement with headbox on participant’s right:

26.5.3 Corrugator placement (miniature sensors)
- The first sensor is placed above the eyebrow and directly in line with inside corner of the eye. You should place this sensor as close to the eyebrow as possible.
- The second sensor is placed directly next to the first sensor and to the outside of the eye.
- Plug end of sensor leads into the headbox. Place the first sensor lead into the – (bottom) channel and the second into the + (top) channel.
26.5.4 Zygomatic placement (miniature sensors)
- Draw an imaginary line between the corner of the mouth and the indentation at the top of the ear. Place the first sensor directly in the center of this imaginary line.
- Place the second sensor directly next to this sensor and closer to mouth on this imaginary line.
- Plug end of sensor leads into the headbox. Place the first sensor lead into the – (bottom) channel and the second into the + (top) channel.
26.5.5 Heart Rate placement (standard sensors)
- You will place one sensor on the inside of each forearm. The exact location does not have to be precise. However, you should make certain not to place the sensor directly on top of a vein or on a hairy section of the arm.
- Plug end of sensor leads into the headbox. Place the sensor lead on the left are into the – (bottom) channel and the lead on the right arm into the + (top) channel.
26.5.6 Skin Conductance placement (standard sensors w/ special gel)
- Prior to attaching these sensors, you will need to place a second set of sensor collars directly on the palm of the hand. This is to make certain that the surface area of the contact remains constant (and is not affected by smearing gel under the collar).
- You will place these collars on the fleshy part of the palm under the pinky. Place the two sensors vertically on the palm with the outer edges of the collars just touching. After placing each collar, remove the adhesive covering.
- You will place each sensor directly on top of these collars. It is very important that you line up the collars exactly. First align one edge and then very carefully align sides while placing.
- If the sensor appears to be insecurely attached, you can wrap tape around the sensor cup to secure more firmly to the palm.
- Plug end of sensor leads into the extensions hanging out of the skin conductance amplifier (into where it says subject input). Place the top sensor lead into the top channel and the bottom sensor into the bottom channel.
26.5.7 Ground sensor placement (standard sensor)
- You will attach a ground sensor in the center of the participant’s forehead. Attach this sensor such that the sensor lead is pointing up and back toward the participants ear to avoid the lead dangling in the participants face.
- Plug end of sensor leads into the ground channel on the headbox.
26.6 Sensor Removal and Cleaning
Disconnect each sensor lead from the headbox and drape to the side of the participant so that you do not step on the leads.
Carefully remove the electrodes from the participant. For the facial EMG sensors, it is often best to place one finger on the participants face directly next to the sensor to avoid the skin pulling while removing the sensor. It is very important that you do not pull on the sensor leads. Pull on the sensor collar tabs to remove.
Bring all of the sensors (and the gel applicator) to the sink in the recovery rom, and follow the cleaning instructions.
26.7 Prepping Startle: Quick Reference
These instructions refer to Corrugator/Orbicularis (miniature sensors) and Ground placement (large sensors)
- Clean all sites with alcohol prep pad.
- Clean all sites with NuPrep (exfoliant).
- Fill sensors with gel, and apply. (you should be talking to the participant and making them comfortable during this time). Sensors should already have collars on them and orb collars should already be cut.
- Plug electrodes into headbox
- Check impedances from the hookup.
- All impedances should be less than 10. Re-prep if necessary.
- Verify that signal to noise ratio is adequate.
- Confirm that you can see eyeblinks on the orb channel.
26.8 Checking Sensor Impedance
- Open Neuroscan and go into File>LoadSetup> and then load
C:\Local\LocalLabema1\Labema1_Screen.ast - Click “Aqusition” at the top of the screen and then click “Impedences” Verify that all impedences are below 10 microvolts.
- Check for excessive signal noise by selecting the small green arrow on the toolbar to view the actual EEG signal. Ask participant to blink twice very hard to check recording.
- Make sure that the scale in the lower right corner is at -512 microvolts and 1 second. (Correct by pressing up up/down left/right arrows on keyboard)
27 Sensor Cleaning Instructions
27.1 EEG Cap Cleaning Instructions
- Remove the sticky collars and any tape from the external sensors.
- Fill the cap cleaning container (clear rectangular tupperware) with warm soapy water.
- Let the cap soak in the warm soapy water for a few minutes and stir around to clean.
- Hold each of the external sensors, and the inside cup of each of the cap sensors, under the water stream from the faucet to remove gel.
- Use the toothbrush or “Orange Sticks” in the drawer to scrub out remaining gel. Check each sensor to make sure that all gel is removed for the inside cup.
- Clean the outside of all sensors with water from faucet (top of cap)
- Once you are confident that all the gel is removed from the sensors, place the cap in the disinfectant underneath the sink for at least 10 minutes. It is important not to leave the cap soaking for more than 30 minutes or it will begin to deteriorate.
- While you are waiting, clean the gel applicators. Shoot all gel from applicator in the trash or down the sink. Dispose of the blunt tip in trash. Fill applicator with water and shoot through top a few times to make sure it is cleaned inside.
- Remove EEG cap from disinfectant and rinse. Fill the tupperware full of clean water and rinse repeatedly (with fresh water) until no more bubbles appear. This is to make certain that all disinfectant is clean from the cap or else it will smell and deteriorate.
- Hang cap from hook to right of sink with the connector end carefully tucked on top where it can’t get dripped on.
IMPORTANT NOTE: Cleaning the cap carefully is VERY important. The caps cost close to $1000 each. You must make certain that ALL gel is out of the sensor cups. Even a minute amount of residual gell will dramatically reduce the life of the cap and the integrity of subsequent data collection. Also, never let the end connector get wet.
27.2 Sensor Removal and Cleaning
Remove sensor sticker collars from each sensor. Do not pull on the leads; hold by the sensor cup and the tab on the sensor collar.
If you can’t start cleaning immediately, it’s okay to soak the cup ends in clean water for 5-10 minutes until you are able to start. This makes it easier to clean later by preventing the gel from drying out. It’s okay to put them in clean water with the EEG cap, but do NOT put the sensors in soapy water. Be sure the plug ends stay dry!
Place each sensor cup directly under the jet stream from the faucet. Make certain that the end of the sensor leads do not get wet. Hold the sensor close to the bottom of the sink to reduce splashing. Move the orientation of the sensor around relative to the jet stream to allow the water to hit the sensor cup from different angles. Do this for 10-15 seconds.
Remove the sensor from the water and blow firmly on the cup to remove the water. A clean sensor will appear matte-dry and not at all shiny. Any shine visible means there is still gel present.
Repeat steps 2-3 until there is absolutely no residual gel on the sensor cup surface. It is very important that the surface is completely clean.
Place the sensors in the disinfectant solution (under sink) for approximately 5 minutes. Ok to put the sensors in at the same time as the cap.
While the sensors are disinfecting, clean the gel applicator and tip.
- Squirt excess gel into the garbage can
- Remove the plunger and fill the applicator with water, and squire though the applicator. Repeat a few times
- Disconnect the applicator tip and blow through it
- Inspect the tip and make certain that you can see through it with no residual gel.
- Clean the applicator body
- Put the applicator body and tip back into the organizer on the sink
Remove the sensors from the disinfectant and rinse off disinfectant thoroughly with water. Be sure to put the lid back on the disinfectant.
Squirt distilled water onto the inside surface of each sensor cup as a final rinse.
Hang the electrodes from the sensor rack to air dry. Make certain that the end of the sensor leads do not hang into the sink.