Code
plot(pressure)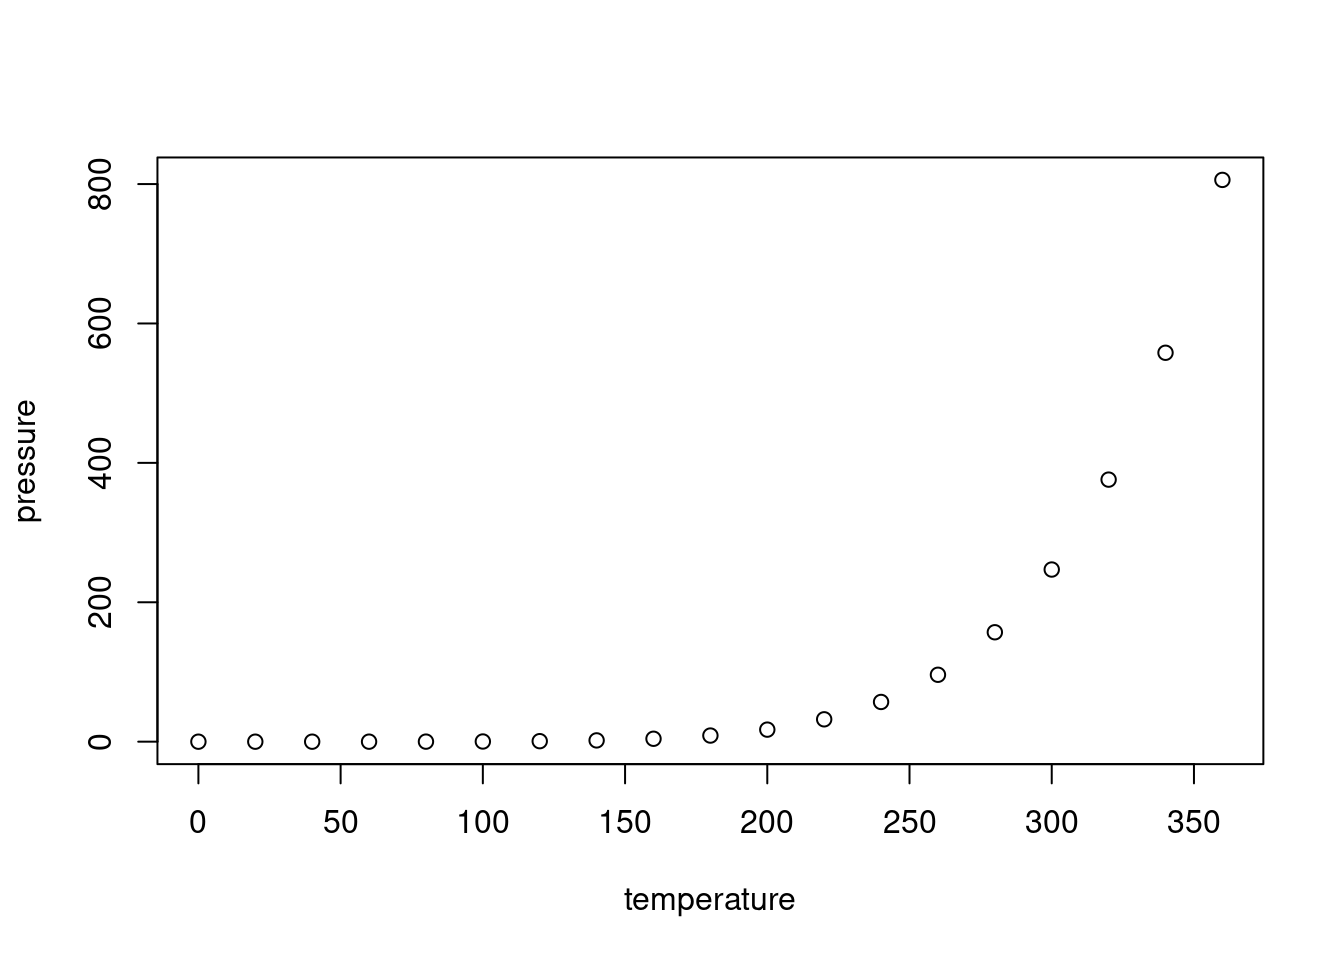
demo <- function(x) variable_2
plot(pressure)
library(tidyverse)── Attaching core tidyverse packages ──────────────────────── tidyverse 2.0.0 ──
✔ dplyr 1.1.4 ✔ readr 2.1.5
✔ forcats 1.0.0 ✔ stringr 1.5.1
✔ ggplot2 3.5.1 ✔ tibble 3.2.1
✔ lubridate 1.9.3 ✔ tidyr 1.3.1
✔ purrr 1.0.2
── Conflicts ────────────────────────────────────────── tidyverse_conflicts() ──
✖ dplyr::filter() masks stats::filter()
✖ dplyr::lag() masks stats::lag()
ℹ Use the conflicted package (<http://conflicted.r-lib.org/>) to force all conflicts to become errorsRows: 5
Columns: 1
$ x <int> 1, 2, 3, 4, 5this sentence is in red
This is an alternative method but more complex: I love R.
red yellow green blue
yellow background for better contrast
Here’s the answer! This can be as long as you want and contain text, code, output etc
Use divs to specify content to only appear in certain formats:
Will only appear in HTML.
Normally, a link to a qmd file functions as a link to the rendered html of that file. To link to a qmd file that is to be downloaded or viewed as raw text, you must link to the raw.github user content: