library(tidyverse)
library(tidymodels)

theme_set(theme_classic())19 Appendix 2: Simulations of Model Performance Bias and Variance by Resampling Techniques
19.1 General Setup
Load libraries
19.2 DGP
Function to generate n_obs of simulated observations
- DGP is linear on all
x+ normal error with sd =irr_err - y is simple sum such that all coefficients = 1
- features are correlated based on
sigma
simulate_DGP <- function (n_obs, n_features, irr_err, mu, sigma){

  x <- MASS::mvrnorm(n_obs, mu = mu, Sigma = sigma) |>
    magrittr::set_colnames(str_c("x", 1:n_features)) |>
    as_tibble()

  x |>
     mutate(y = rowSums(t(t(x)*b)) + rnorm(n_obs,
                                        mean = 0,
                                        sd = irr_err))
}
19.3 Simulation settings
n_sims <- 1000  # number of simulations
n_obs <- 300 # number of observations

n_features <- 20
mu <- rep(0, n_features)
sigma <- matrix(.3, nrow = n_features, ncol = n_features)
diag(sigma) <- 1
irr_err <- 10
b <- rep(0.5, n_features) # no b0 so set to 0

set.seed(123456)
# first call so that we can set up recipe
df <- simulate_DGP(n_obs, n_features, irr_err, mu, sigma)
rec <- recipe(y ~ ., data = df)

rmse_combined = NULL  # to store RMSE for all methods
19.4 Get simulation dfs
dfs <- rep(n_obs, n_sims) |>
  map(\(n_obs) simulate_DGP(n_obs, n_features, irr_err, mu, sigma))
19.5 What is the TRUE model performance
The irreducible error is set to 10 but our model will have some reducible error too so the true performance of our model will be worse than 10
- The DGP is linear
- but we only have 300 observations
- and we have 20 features
Lets fit many models of n = 300 (the size of our final model) and assess performance in really big samples of new data (ah the luxury of simulated data!)
# models based on full n for each simulation run
models <- dfs |>
  map(\(df) linear_reg() |> fit(y ~ ., data = df))

# big samples of held out data for high precision assessment of models
# 1 for each model
outs <- rep(10000, n_sims) |>
  map(\(n_obs) simulate_DGP(n_obs, n_features, irr_err, mu, sigma))

# list of predictions for out from each model
preds <- map2(models, outs, \(model, out) predict(model, out))

# get mean rmse in big held out data set for 1000 full n models
# should be very precise
rmse_true <- map2_dbl(outs, preds, \(out, pred)  rmse_vec(out$y,
                                                      pred$.pred)) |>
  mean()

message("True RMSE = ", rmse_true)
True RMSE = 10.3728762850761Parallel processing for resampling methods with fit_resamples()
cl <- parallel::makePSOCKcluster(parallel::detectCores(logical = FALSE))
doParallel::registerDoParallel(cl)
19.6 Validation set
19.6.1 80/20 split
Here we simulate repeated use of the validation set approach to assess our model performance
rmse_combined <- dfs |>
  map(\(df) validation_split(df, prop = .80)) |>   # validation set split
  map(\(split) linear_reg() |> fit_resamples(resamples = split,
                                              preprocessor = rec,
                                              metrics = metric_set(rmse))) |>
  map(\(fits) collect_metrics(fits, summarise = TRUE)) |>
  list_rbind() |>
  mutate(method = "val_set_80") |>       # label results in df
  bind_rows(rmse_combined)
Warning: `validation_split()` was deprecated in rsample 1.2.0.
ℹ Please use `initial_validation_split()` instead.19.7 50/50 split
Here we simulate repeated use of the validation set approach to assess our model performance
rmse_combined <- dfs |>
  map(\(df) validation_split(df, prop = .50)) |>   # validation set split
  map(\(split) linear_reg() |> fit_resamples(resamples = split,
                                              preprocessor = rec,
                                              metrics = metric_set(rmse))) |>
  map(\(fits) collect_metrics(fits, summarize = TRUE)) |>
  list_rbind() |>
  mutate(method = "val_set_50") |>       # label results in df
  bind_rows(rmse_combined)
19.8 K-fold
19.8.1 Simple 5-fold
rmse_combined <- dfs |>
  map(\(df) vfold_cv(df, v = 5)) |>   # 5-fold
  map(\(split) linear_reg() |> fit_resamples(resamples = split,
                                              preprocessor = rec,
                                              metrics = metric_set(rmse))) |>
  map(\(fits) collect_metrics(fits, summarize = TRUE)) |>
  list_rbind() |>
  mutate(method = "5-fold") |>       # label results in df
  bind_rows(rmse_combined)
19.8.2 Simple 10-fold
rmse_combined <- dfs |>
  map(\(df) vfold_cv(df, v = 10)) |>   # 10-fold
  map(\(split) linear_reg() |> fit_resamples(resamples = split,
                                              preprocessor = rec,
                                              metrics = metric_set(rmse))) |>
  map(\(fits) collect_metrics(fits, summarize = TRUE)) |>
  list_rbind() |>
  mutate(method = "10-fold") |>       # label results in df
  bind_rows(rmse_combined)
19.8.3 3x 10-Fold
rmse_combined <- dfs |>
  map(\(df) vfold_cv(df, v = 10, repeats = 3)) |>   # 3x10-fold
  map(\(split) linear_reg() |> fit_resamples(resamples = split,
                                              preprocessor = rec,
                                              metrics = metric_set(rmse))) |>
  map(\(fits) collect_metrics(fits, summarize = TRUE)) |>
  list_rbind() |>
  mutate(method = "3x10-fold") |> # label results in df
  bind_rows(rmse_combined)
19.9 Bootstrap Resampling
19.9.1 10 resamples
rmse_combined <- dfs |>
  map(\(df) bootstraps(df, times = 10)) |>   # 10 boots
  map(\(split) linear_reg() |> fit_resamples(resamples = split,
                                              preprocessor = rec,
                                              metrics = metric_set(rmse))) |>
  map(\(fits) collect_metrics(fits, summarize = TRUE)) |>
  list_rbind() |>
  mutate(method = "boot_10") |>       # label results in df
  bind_rows(rmse_combined)
19.9.2 100 resamples
rmse_combined <- dfs |>
  map(\(df) bootstraps(df, times = 100)) |>   # 100 boots
  map(\(split) linear_reg() |> fit_resamples(resamples = split,
                                              preprocessor = rec,
                                              metrics = metric_set(rmse))) |>
  map(\(fits) collect_metrics(fits, summarize = TRUE)) |>
  list_rbind() |>
  mutate(method = "boot_100") |>       # label results in df
  bind_rows(rmse_combined)
19.9.3 1000 resamples
rmse_combined <- dfs |>
  map(\(df) bootstraps(df, times = 1000)) |>   # 1000 boots
  map(\(split) linear_reg() |> fit_resamples(resamples = split,
                                              preprocessor = rec,
                                              metrics = metric_set(rmse))) |>
  map(\(fits) collect_metrics(fits, summarize = TRUE)) |>
  list_rbind() |>
  mutate(method = "boot_1000") |>       # label results in df
  bind_rows(rmse_combined)
19.10 Summarize
rmse_combined |>
  group_by(method) |>
  summarize(rmse_mean = mean(mean),
            rmse_sd = sd(mean),
            n = n())
# A tibble: 8 × 4
method rmse_mean rmse_sd n
<chr> <dbl> <dbl> <int>
1 10-fold 10.4 0.442 1000
2 3x10-fold 10.4 0.436 1000
3 5-fold 10.5 0.455 1000
4 boot_10 10.7 0.491 1000
5 boot_100 10.7 0.451 1000
6 boot_1000 10.7 0.449 1000
7 val_set_50 10.8 0.672 1000
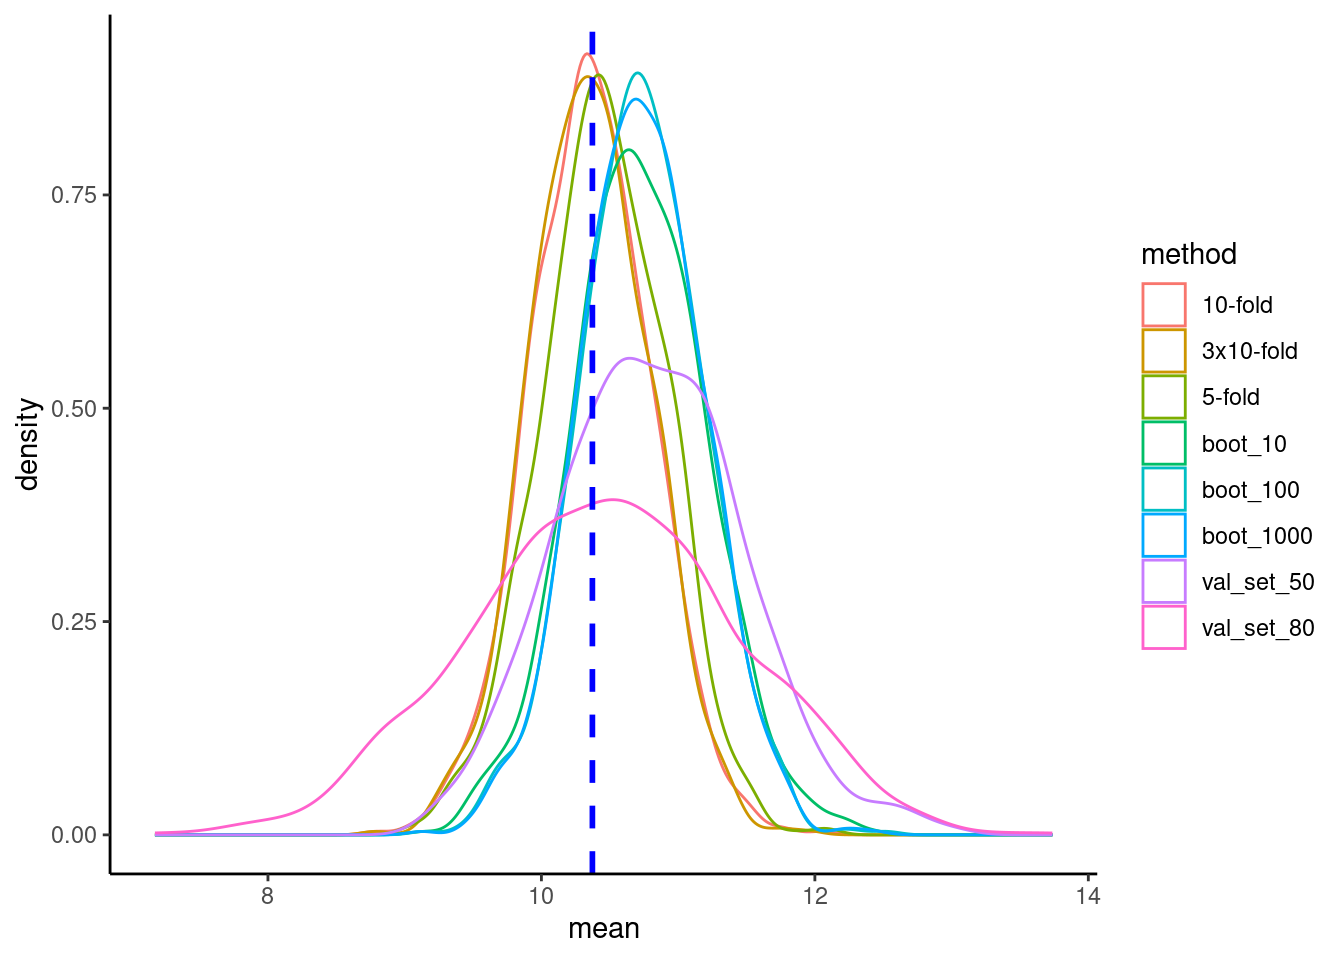
8 val_set_80 10.5 0.985 100019.11 Plot sampling distributions
rmse_combined |>
  ggplot(aes(x = mean, color = method)) +
  geom_density() +
  geom_vline(aes(xintercept = mean(rmse_true)),
            color = "blue", linetype = "dashed", linewidth = 1)